Reports
Reports gives you accounting-oriented views on top of the same sales, stock and purchase data as Analytics, formatted for bookkeeping rather than trend-spotting. Find it under Reports.
COGS by period
Cost of goods sold broken down by month, quarter or year over a chosen date range (presets from "last 30 days" to "all time", or any two dates - see Analytics), each row showing:
- Units sold
- Revenue, COGS, selling fees (channel commission), profit, and margin %
By product
The same revenue/COGS/fees/profit/margin breakdown as COGS by period, but grouped by product instead of by time period, over the chosen date range.
Profit
The bottom line, period by period: what came in, what it cost to make, and what the workshop spent to keep the lights on.
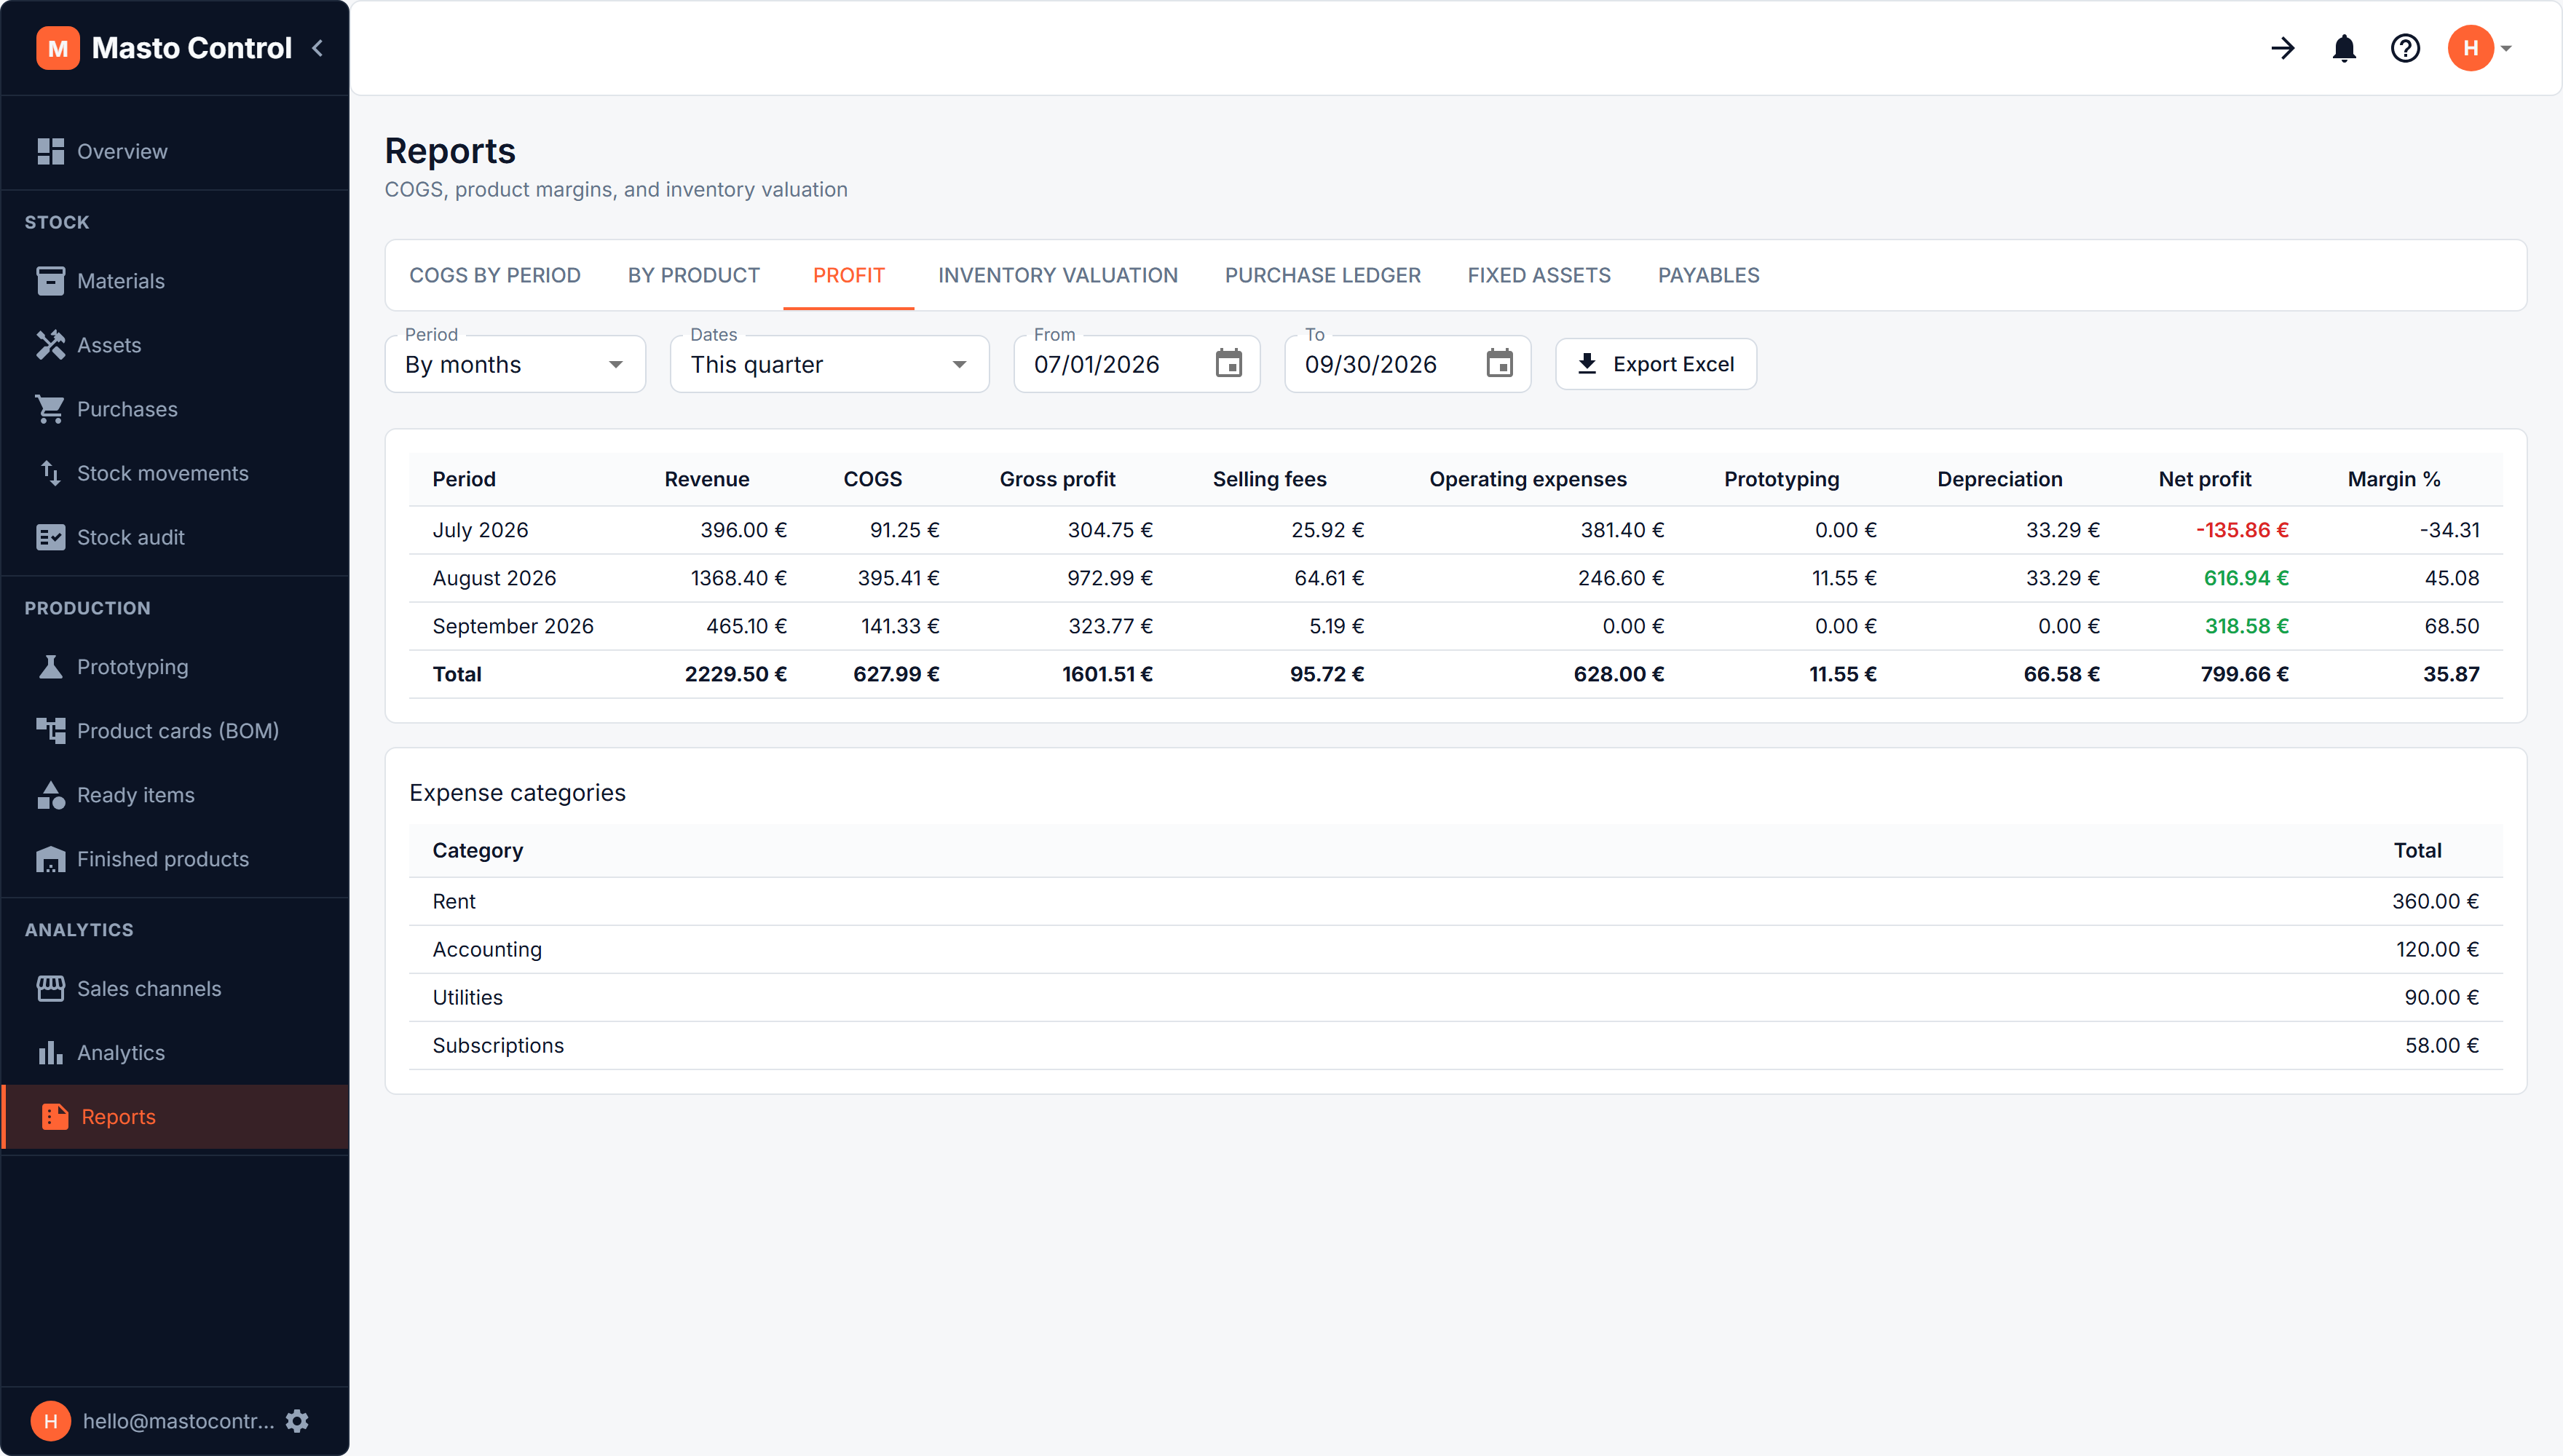
Each row runs:
Revenue − COGS = Gross profit, then + shipping charged (what buyers paid for delivery, without the VAT) − selling fees (the channel's fees as recorded on each order) − shipping cost (postage and couriers you paid) − operating expenses (rent, utilities, subscriptions) − prototyping (materials spent on samples, which never reach a sale) − depreciation (tools and equipment) = net profit, with the margin as a percentage of revenue.
Underneath, operating expenses are broken down by category, so "where did 1 400 € of expenses go" has an answer without opening another screen.
Two things are deliberately excluded, because they are already counted elsewhere:
- Expenses that were spread over goods on a receipt (delivery, customs) — they are inside COGS already.
- Materials still sitting in stock — the report follows sales, not purchases.
Revenue is net of VAT throughout the reports: an order's VAT is taken out at the rate on each line, or as the marketplace stated it.
Sales ledger
Every posted order with its number, by period and one by one: net, VAT, gross, the channel's fees, the shipping you paid, the net payout, and whether it has been paid. Voided orders are listed too, because their numbers are part of the sequence a bookkeeper will look for, but they count for nothing. Underneath, VAT by rate adds up net, tax and gross per rate for the period - the figures a VAT return asks for.
Inventory valuation
A snapshot of what your current stock is worth:
- Materials — quantity and value on hand, per material
- Finished goods & items — quantity and value on hand, per product/component, labeled as Product or Component
- Totals: materials value, finished goods value, and total inventory value
Materials are valued at what is available — stock that has already been reserved into finished goods is counted inside those goods, not twice.
You can value stock as of a past date, and the report is honest about what that means: materials are replayed from the movement log, so a purchase entered late counts from the day it was entered; finished goods are left out of a past-date valuation entirely, because there is no movement history for them yet and any figure would be a guess.
Purchase ledger
Everything bought in a period, from the paperwork side: receipts by period and one row per document, split into inventory, fixed assets, expenses and VAT, with what is still unpaid.
It also lists purchases with no document attached — real purchases that never got a receipt, which the ledger above cannot cover. They are shown rather than hidden, so the gap is visible.
Fixed assets
The register of what the workshop owns: every item with its purchase date and cost, accumulated depreciation, what was charged in the chosen period, current book value and status. Written-off items stay listed with their reason.
Payables
What is still owed to suppliers, aged from the document date into 0-30, 31-60, 61-90 and 90+ day buckets, by supplier and by document.
There are no payment terms in Masto Control, so nothing here is called overdue — the ageing is from the document date, and what counts as late is your judgement.
Receivables
The mirror of payables: posted orders not yet marked paid, aged from their due date into not-yet-due, 0-30, 31-60, 61-90 and 90+ days overdue, by customer and by order. An order without a due date is aged from its sale date. Marketplace orders are normally settled by the payout and marked paid then, so what is left here is the wholesale and direct invoices.
Excel export
Every tab has its own Export Excel button, producing a spreadsheet of exactly what's on screen (same grouping and date range; the range is in the file name) — handy for handing a specific report to a bookkeeper without them needing app access.
Reports and Sales analytics cover overlapping ground but serve different purposes: Analytics is for spotting trends (forecasting, by-channel comparison), Reports is for accounting close (COGS, margins, profit, valuation) with per-tab export.