Sales analytics
Analytics turns every registered sale — manual or imported from Shopify — into reporting. Find it under Analytics.
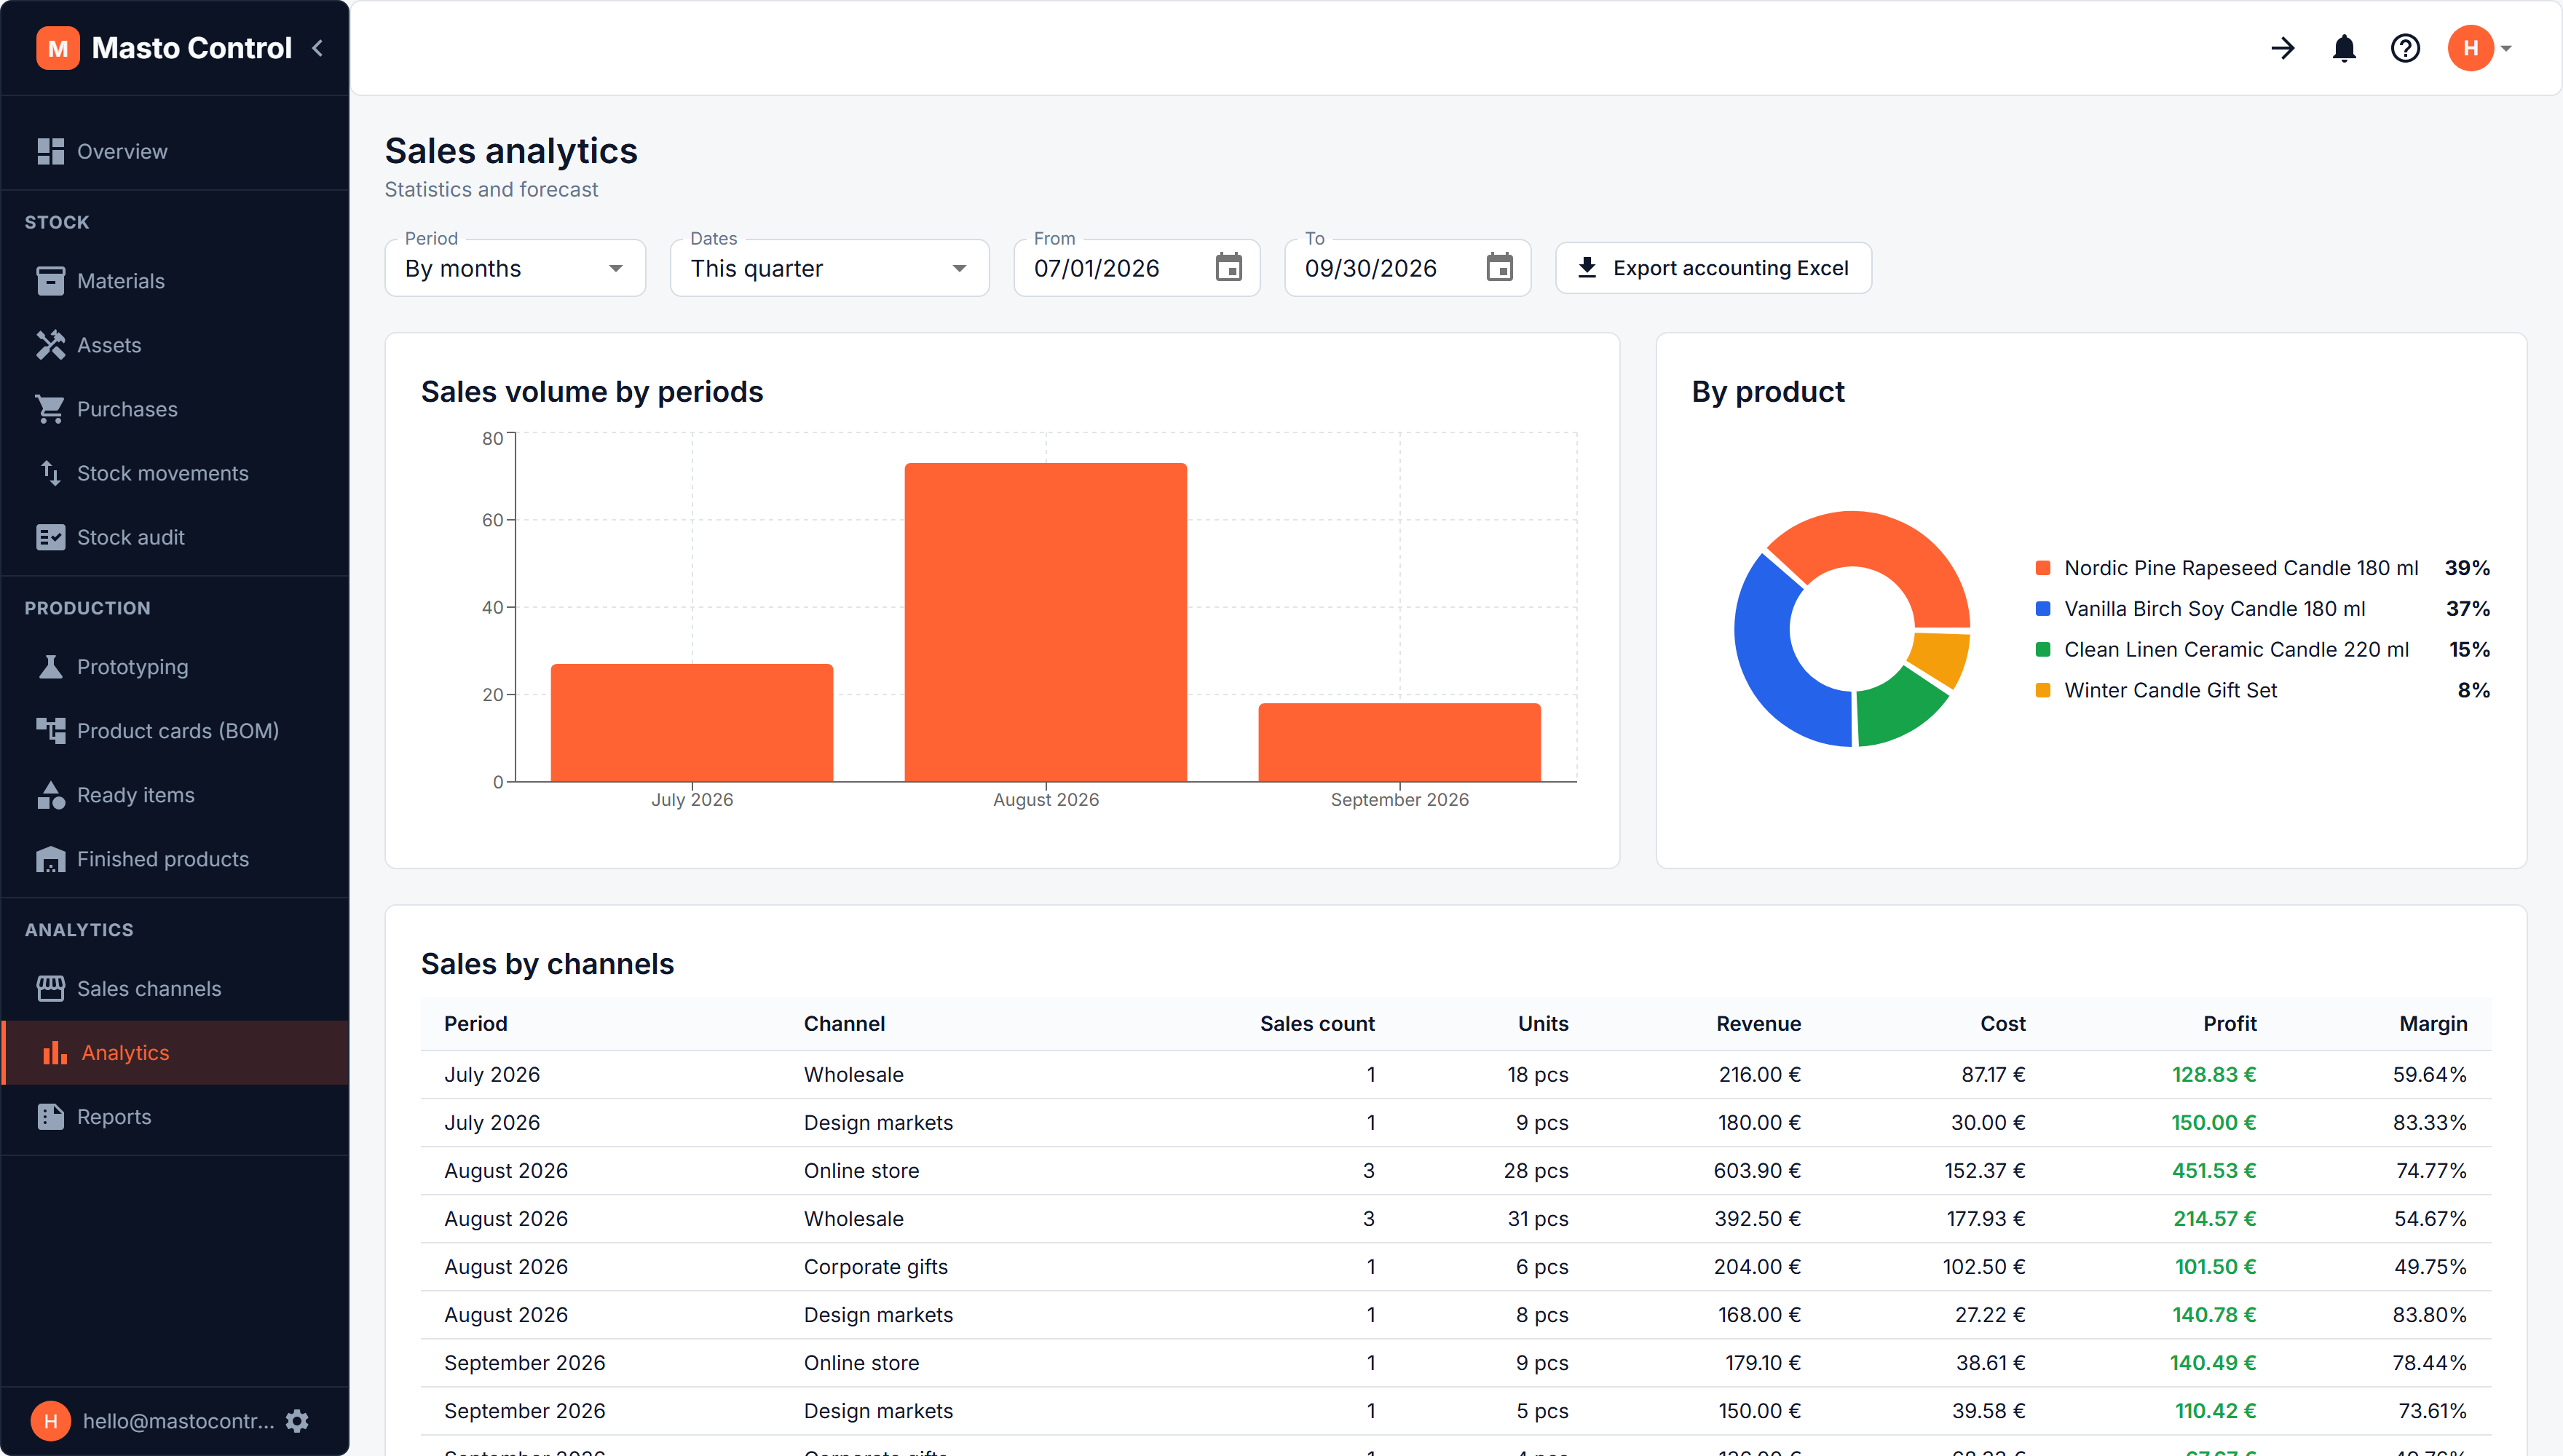
Time periods
Pick a date range and how to group it: by week, month, quarter, or year. The range comes with presets - last 30 days (the default), this or last month, this quarter, this or last year, the last 12 months, all time - and any two dates you type turn it into a custom range. A range can cross a year boundary; every bar and row carries its year ("March 2026"), so two Marches a year apart stay apart.
The range you pick is remembered, and it is the same one Reports uses, so moving between the two keeps you looking at the same weeks.
Each view shows sales volume per period plus a forecast: the average monthly sales of each product over the last three months.
By product
See which products sell, and how much, ranked over the selected period.
By channel
A breakdown of sales count, units, revenue, cost, profit, and margin per sales channel — this is what tells you whether your Shopify store, a marketplace, or offline sales are actually carrying your revenue.
Accounting export
Export Excel (accounting) produces a spreadsheet formatted for handing to a bookkeeper or importing into accounting software, covering the selected period.